📊 Charts
328
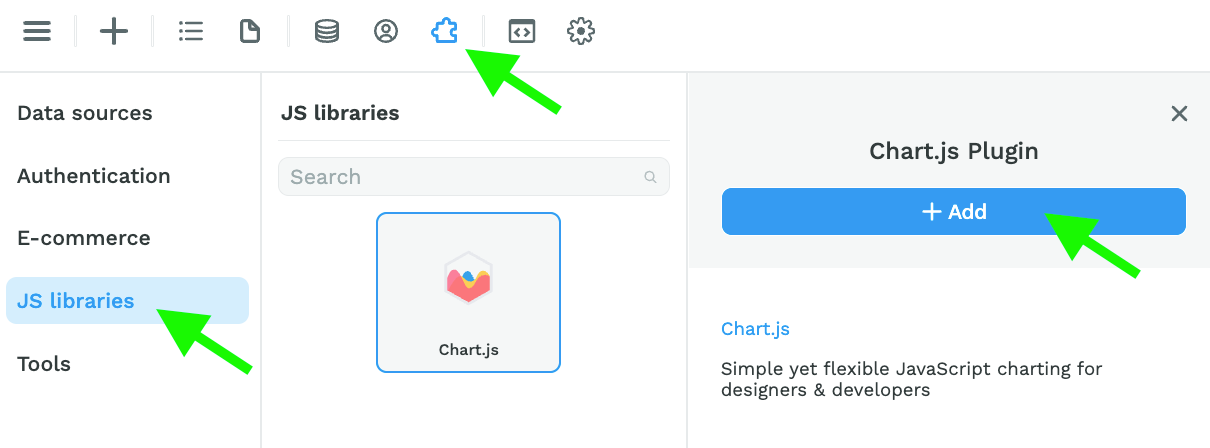
To add no-code Charts to your WeWeb project, you can add the "Charts.js" plugin in the "Plugins" > "JS libraries" menu.
Don't be put off by the JS description if you don't code! The plugin comes with no-code settings 😉

Choose a Chart Template
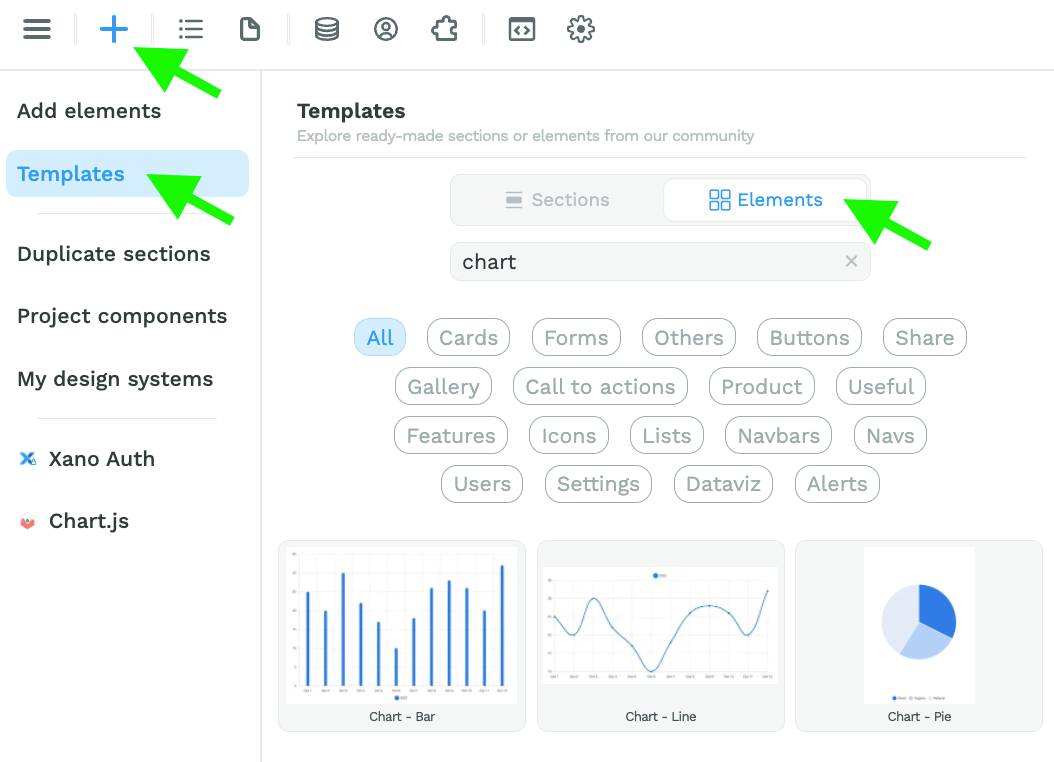
Once you've added the Charts plugin, you can drag and drop a Chart template on the Canvas from the "Add" menu:

Setup and Style a Chart Element
Chart elements have two settings: "Guided" and "Advanced".
To use the "Advanced" mode, we recommend you read the Chart.js documentation to understand what data the library expects.
For most use cases, we recommend using the no-code "Guided" mode.
When using the "Guided" mode, the Element expects the Data in the form of a list, also called an `Array`.
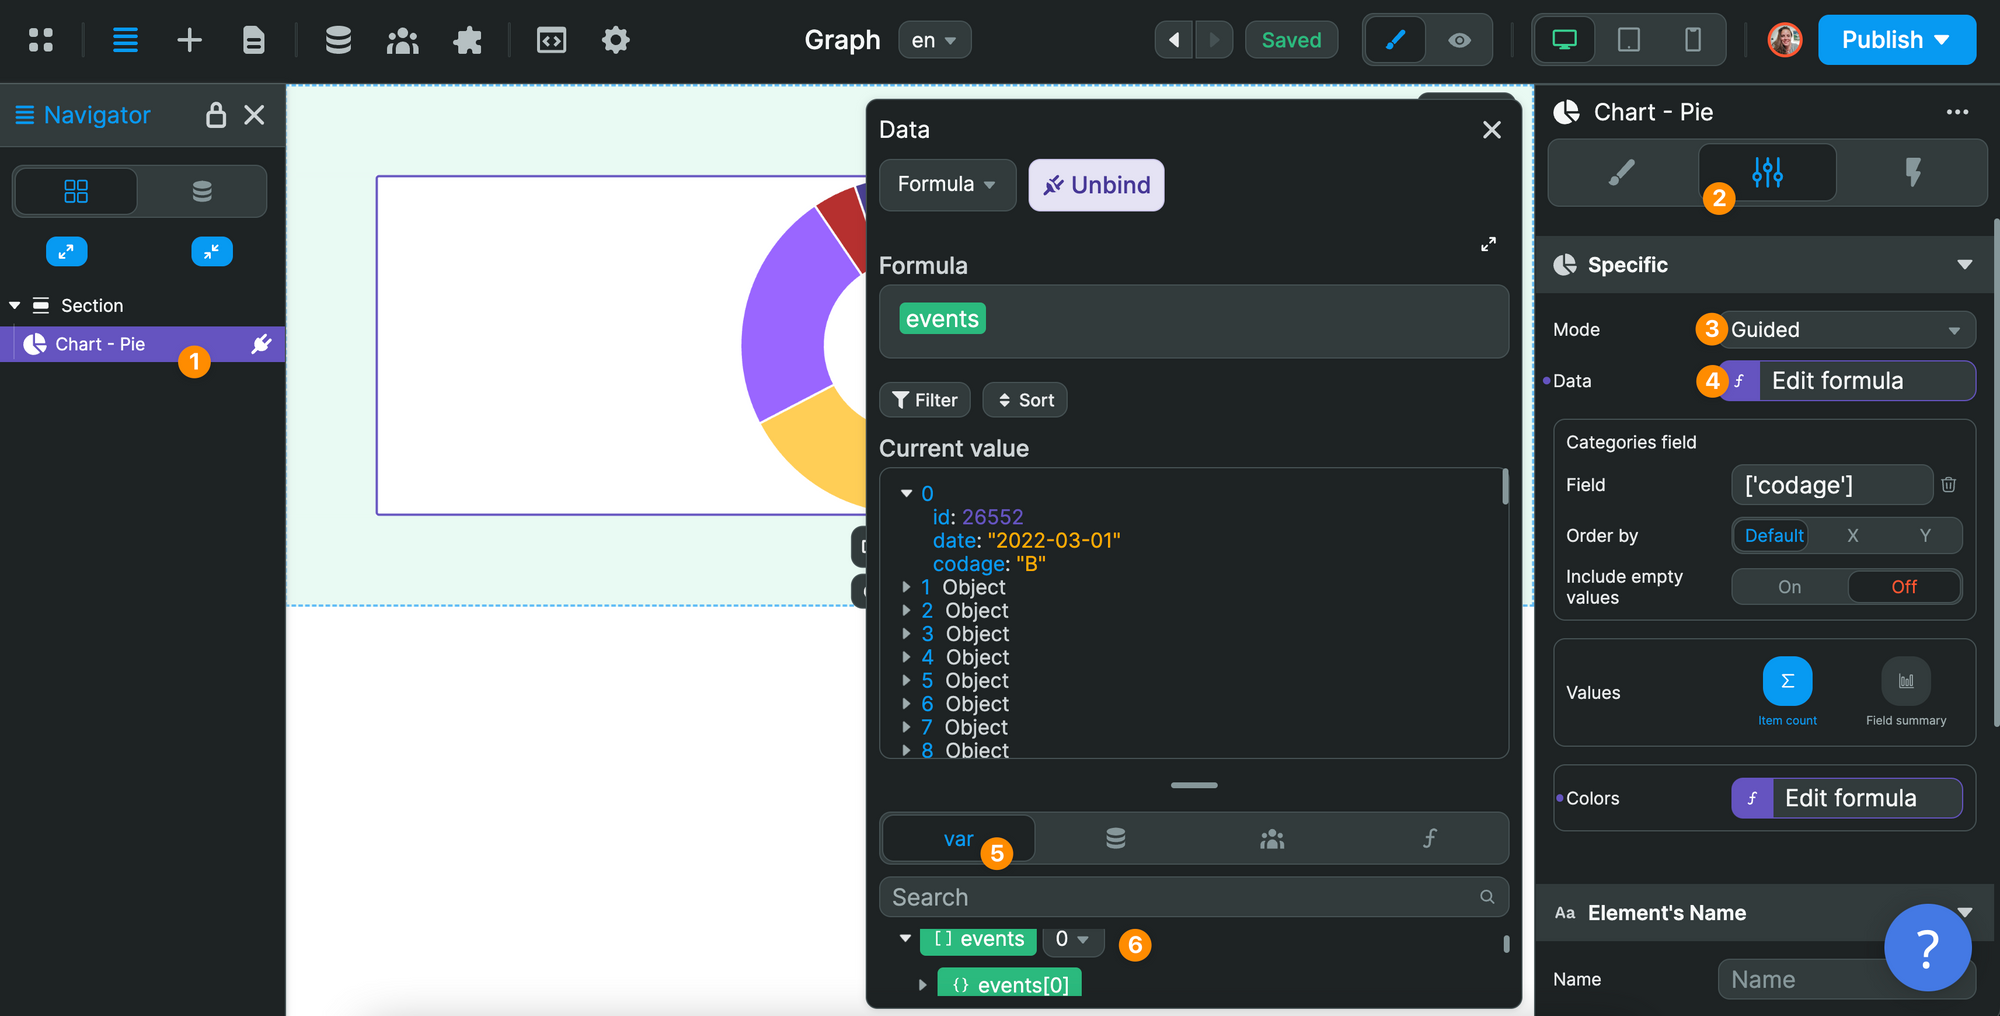
In the example, below, we tell the pie Chart that the Data in the graph is in our events Variable:

When we look at the Current value of the Variable, we can see three things.
First, items are listed in sequential order: 0, 1, 2, 3, 4, etc. This is because the events Variable is a list. In programming, this is often called an Array.
Secondly, we can see that each item appears to be an Object. This is also a programming term that is helpful to understand, even when working with no-code tools.
Finally, when we look at item 0, we can see that the Object contains key / value pairs:
id,date, andcodageare keys.26552,"2022-03-01", and"B"are the corresponding values.
🔥 Pro Tip 🔥
It is helpful to think ofArraysas a list of items in a table in a database where each item in theArray, i.e. eachObject, is a row in the table. Thinking of oneObjectas one row in a table, thekeyis the column name and thevalueis the corresponding value in that row.
This is important because the Chart Element expects you to:
- provide a list of items, i.e. an
ArrayofObjectsin theDatasetting, and - say what values you want to display in the
Fieldsetting.
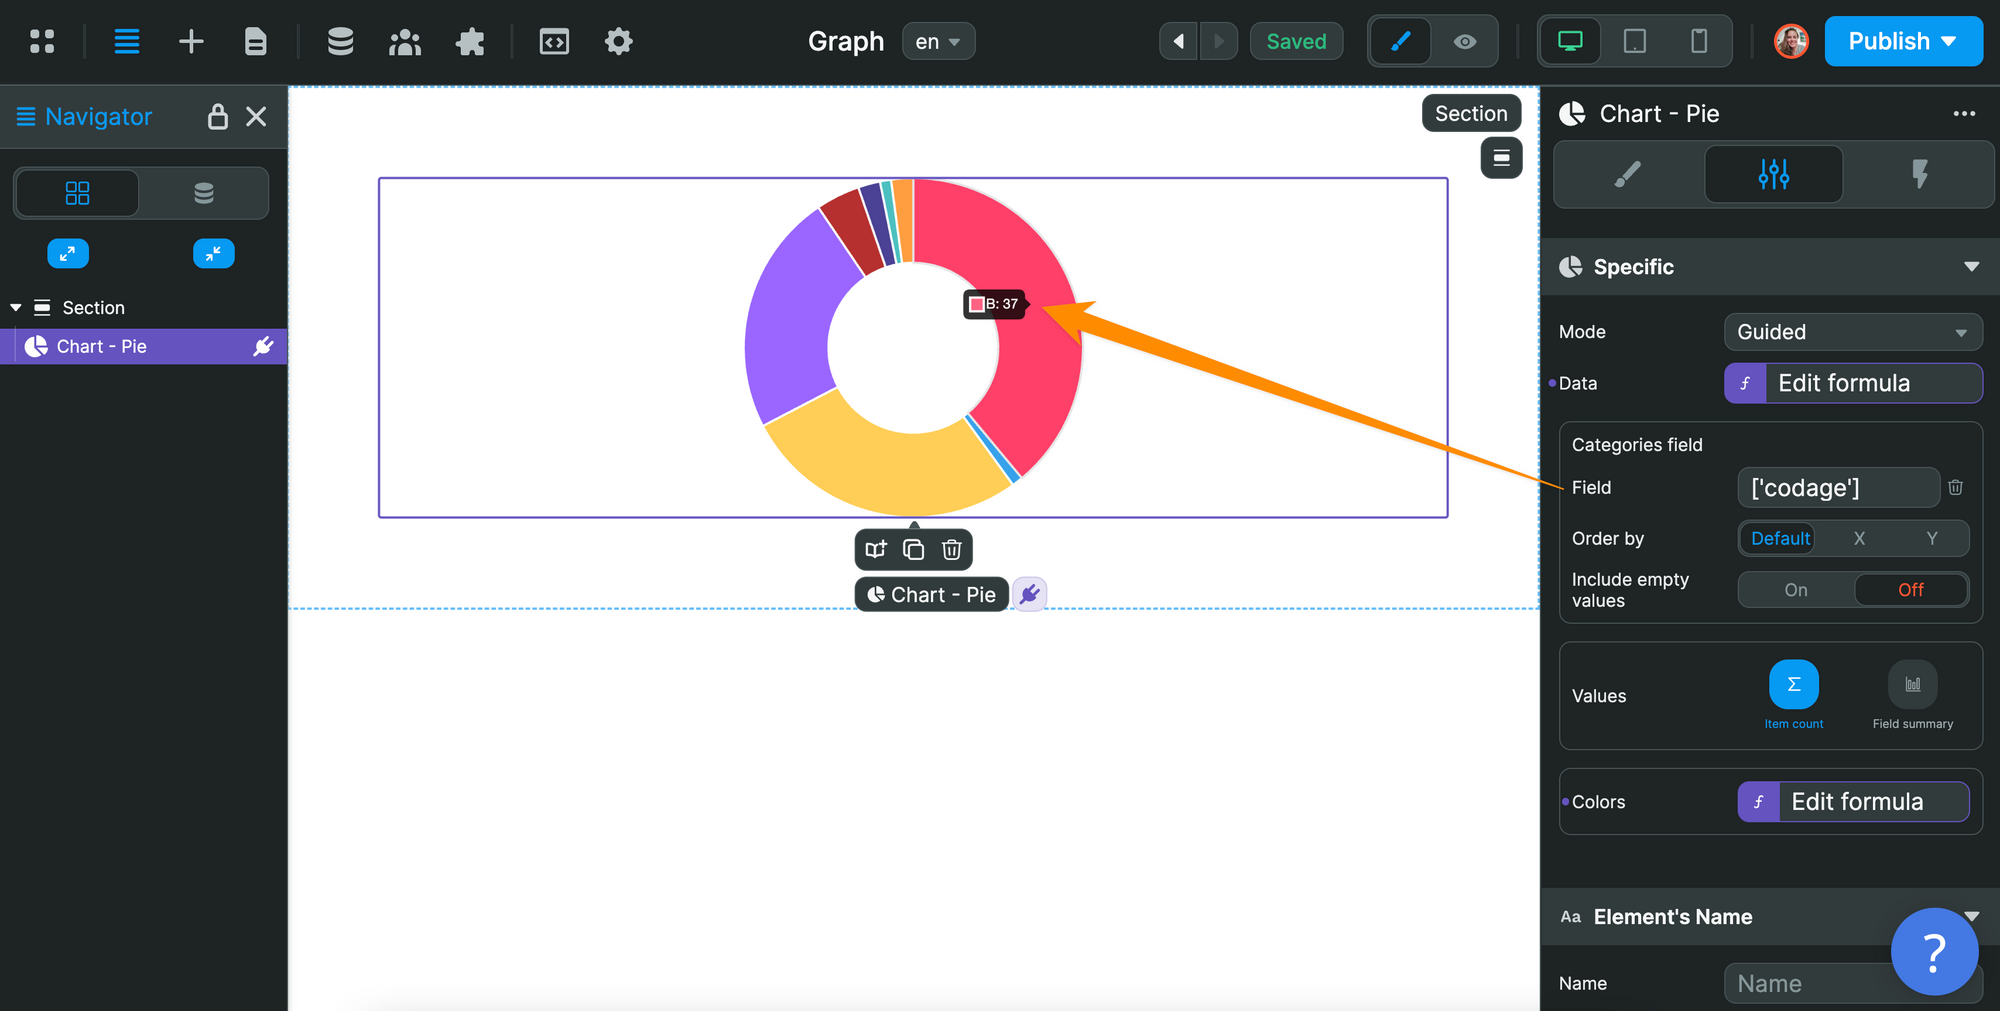
In the example below, we want to make the sum of all the items that have the same value in the codage key:

🔥 Pro Tip 🔥
Arrays and objects are how tools manage to communicate with each other on the web. When a browser makes a request to a server or receives a response from a server – i.e. when two tools need to communicate through an API call – the data needs to be structured so that different tools can understand each other. That's why data is formatted into arrays and objects.